
Data is everywhere and we’ve all seen the ways that data has revolutionized our world. But what does that have to do with architecture and design? My role here at BWBR is specifically focused on ways that data and data visualization can be leveraged to create design solutions that save clients time and make projects run smoother. Let’s take a look at what that can look like in practice.
Data to the Rescue
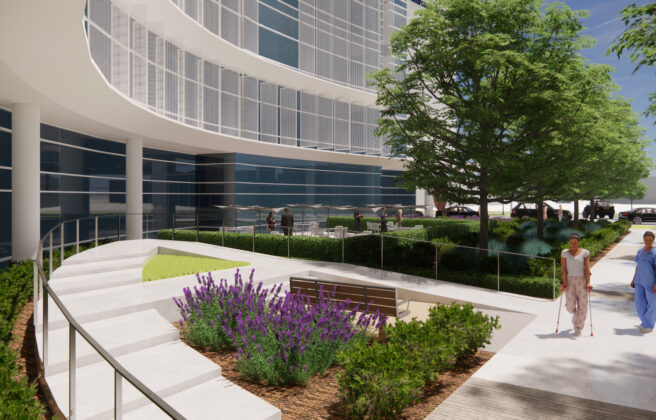
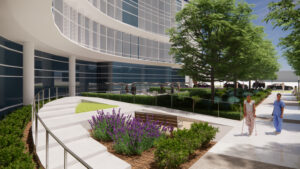
The Lincoln, Nebraska campus of Southeast Community College was planning a new STEM building and needed to understand the true utilization of their classrooms in order to identify gaps and fully map out their need for more space. To bolster their case for a new building, confirm assumptions, and inform internal discussions, our goal was to use data to help guide space planning and development. Was more space needed, or just an optimization of when and where classrooms are scheduled in existing space?
To that end, the client provided their full roster of classes for the impacted spaces for the spring and fall semesters of 2021. Using Python, I then broke the roster into one-minute increments for each classroom – over 60 million rows of data – then totaled them into hours to see overall utilization.
This data was then fed into a custom interactive dashboard in Tableau, which offered the following visualizations:
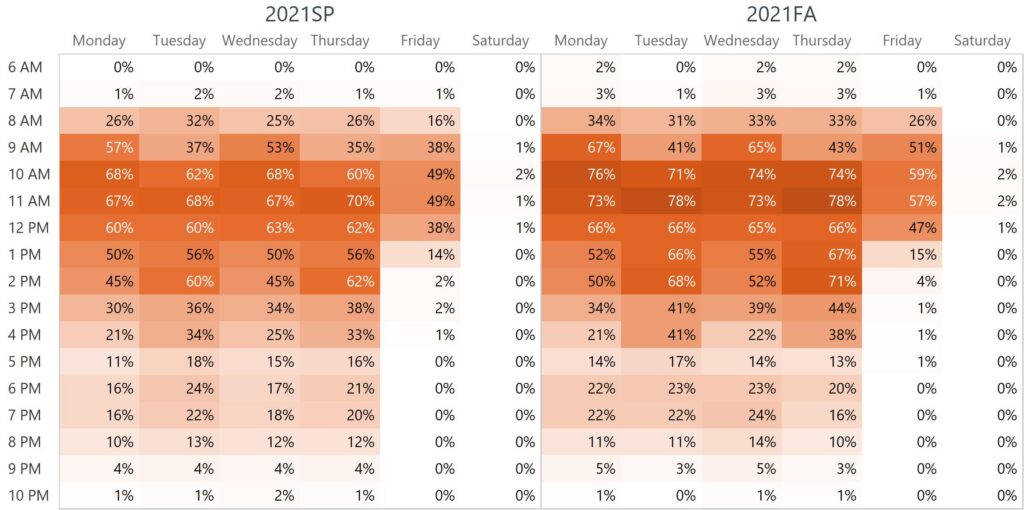
Hourly Utilization Matrix – An hourly grid of utilization for each building and each room.
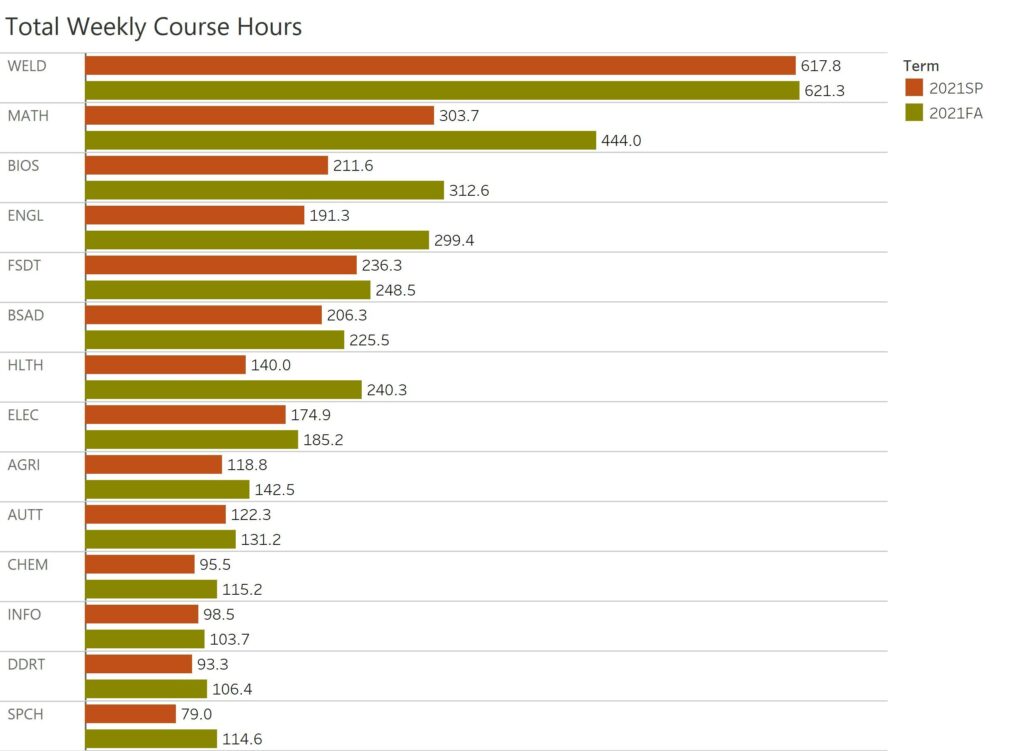
Total Weekly Course Hours – A bar chart of total hours of utilization by each college department.
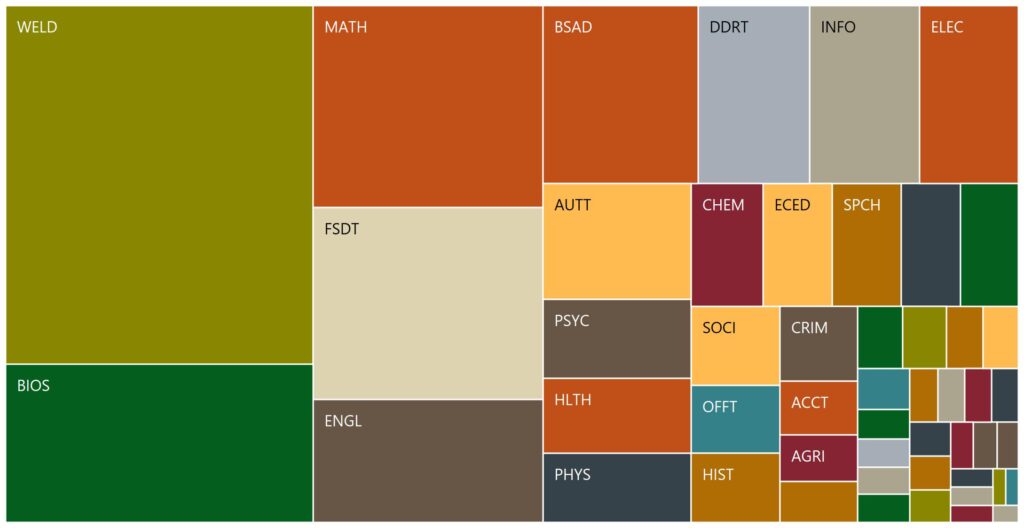
Weekly Course Hours – A tree map of average weekly utilization hours by department.
Moving Forward with Confidence
The value in this approach was being able to see the details of where and when space was actually being used. In analytics, the aggregate often looks very different from the detail. In this case, the client thought they needed more spaces, but the data suggested that a more effective approach would be to focus more on making sure the right types of spaces would be available at the right times, since a deeper look revealed that particular time slots and types of rooms were in greater demand than others.
Now, the client is able to move forward with the project secure in the knowledge that they appreciate their space utilization fully and that the resulting design will give them everything they need.